JS Management makes it easy to track Dealership locations with our data. Here we’re reporting movements UK wide, across many different categories and vehicle types. If you have the time, you can easily compile Dealership trend reports by looking at our previous updates. In this post we are representing changes through March 2024.
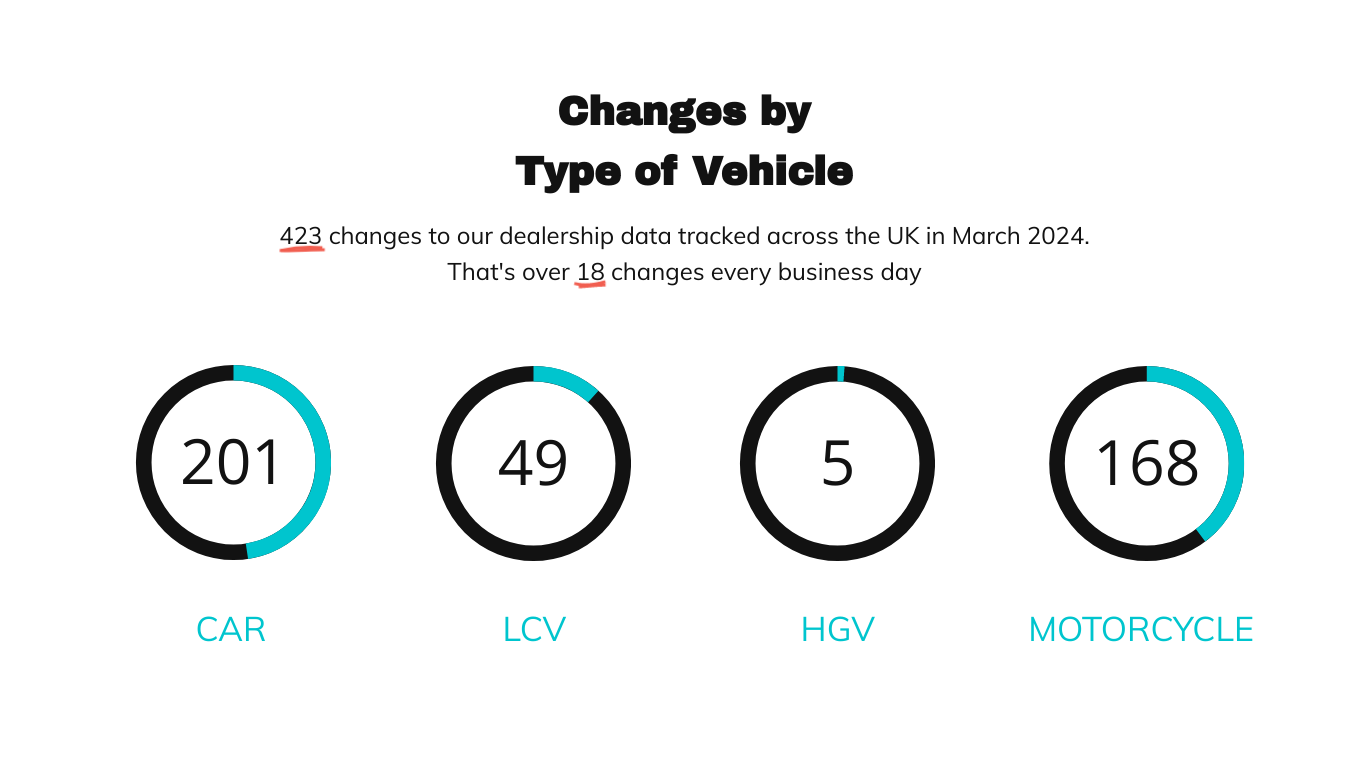
Dealership changes by type of vehicle have increased overall from 388 to 423 since February (breakdown figures are shown in brackets). Car 201 (262), HGV 5, (16), LCV 49 (41) and Motorcycle/ATV 168 (69).
The UK map clearly reports where the changes have occured through March 2024
This months changes in data by site type report Dealerships taking up a fair chunk of the movements for the month at 64%, an increase from the previous month (52%). Aftersales is represented at 23% (vs 29%), used at 6% (5%) and the ‘other’ category down to 5% vs 10% in February.
As we wind down our report for March, we’ll end with changes by franchise category. There are 96 changes by franchise appointed (vs 81 in December), 138 franchises relinquished (vs 85) and 25 site relocations (vs 16) in the previous month). Group Acquisitions, have reduced somewhat this monh, totalling 10 (vs 54 previously).


